Quantitative Analysis of Pooled Ridesharing
Published 6 October 2014. By Philip I. Thomas and Andrew HessIn the past few months, pooled transportation options have emerged in the multi-billion dollar ridesharing industry. Pooled ridesharing fills a niche between taxis and buses where riders can get cheap door-to-door transportation by sharing a vehicle with strangers traveling along a similar route.
Rideshare company Sidecar was the first to market with pooled ridesharing in May. The company that originally caught our attention in the area was Hitch, a ridesharing company focused solely on pooled rides. Since Hitch’s launch on May 18 2014, both rideshare giants Lyft and Uber have implemented test programs for pooled ridesharing using their existing driver bases in the San Francisco Bay area.
Update
Terminology
- Dedicated rideshare: A traditional, taxi-like rideshare where your group controls the vehicle from pickup until drop-off.
- Pooled rideshare: A rideshare where you may share the ride with strangers that are picked up or dropped off along the way to your destination.
Compared to traditional dedicated ridesharing where a customer commissions a full vehicle, Telegraph Research sought to quantify four hypotheses about pooled ridesharing.
Hypotheses:
- Pooled ridesharing has significantly higher driver utilization.
- Pooled ridesharing takes longer for riders to arrive at the destination.
- Pooled ridesharing is only efficient for one rider.
- Fewer drivers are able to service the same number of riders.
In order to validate these hypotheses and to evaluate the feasibility of pooled rides in the rideshare industry, Telegraph Research developed a simulation of pooled ridesharing.
Pooled Ridesharing Basics
Implementations
The companies Hitch, Lyft, and Uber take slightly different approaches to how to pool rides.
Hitch
Hitch was available in San Francisco through an iPhone application and drivers were paid a flat hourly rate. Group size, which was specified before pickup, ranged from one to three passengers.
Cars are treated like buses that continually pick up and drop off users between dynamically-routed locations. After picking up a rider, other passengers may be picked up or dropped off on the way to a destination. In this sense, a busy driver may never have an empty car.
Update
Hitch allowed parties of up to 4 passengers. In all multi-pickup situations, however, the middle rear seat would be kept free to avoid possible awkward situations.
Lyft Line
Lyft Line is available in San Francisco. All standard Lyft drivers (excluding Lyft Premium) are eligible to be assigned pooled rides. Riders are given a strict 60 second window to enter the vehicle after it arrives, and cars only pick up two groups of people. Riders may select whether they are traveling alone or with a second person. Price is determined prior to ordering the car and shown to the passenger, while drivers receive the combined fares of the groups.
Groups are paired based on similarities between their pickup location, destination, and travel route. In this sense, drivers are not dynamically routed, but are assigned a full route consisting of no more than two pickups and two drop-offs.
Uber Pool
Uber Pool is available in limited beta in the San Francisco Bay. All UberX drivers are eligible to be tasked Uber Pool fares. Uber Pool strictly allows groups of only one person, and a maximum of two passengers are in a given Uber Pool rideshare. Uber Pool pricing is dynamic and based on the actual mileage and time of the ride, which is split between the passengers.
Riders are paired based on their pickup location and destination with another rider traveling a similar route. Again, drivers are not dynamically routed, but are assigned a full route consisting of no more than two pickups and two drop-offs.
Advantages of Pooled Rides
Traditional ridesharing apps do not charge based on the number of passengers. Instead, they charge based on capacity, which generally is 3 riders for a standard car and 5 for a standard SUV.
For single riders, such as commuters, purchasing three seats of capacity for a trip is not financially efficient. For this reason, Uber introduced fare splitting to allow riders to split charges to allow riders to split the cost of a full car.
By optimizing for single riders, costs decrease relative to UberX. However, ride times increase.
Niche
It is not uncommon to see pooled rides cost between $3 and $5 for door-to-door service in an urban environment, compared to comparable $6 to $8 for a dedicated car. Uber claims that their pooled option costs 40% less than a dedicated car. One-way transportation on public transit costs about $2 (SF Muni).
Compared to public transportation, pooled rideshares are typically faster due to fewer stops and more comfortable due to fewer passengers. However, arrival time is less predictable - buses run on predetermined time schedules while rideshares provide no estimate about arrival time.
Opportunity
Due to the low price, pooled ridesharing becomes more feasible for commuters and thus more directly competes with public transportation. Attracting commuters brings recurring revenue, and hence will likely drive the growth of pooled ridesharing. Pooled ridesharing primarily works in urban environments where fewer customers own cars or where parking is a significant expense.
Business riders likely prioritize time above marginal cost saving, and hence are unlikely to use pooled ridesharing.
Brand and Culture
Lyft has always promoted social rides by encouraging riders to sit in the front seat, fist bump drivers, and have a friendly conversation during the ride.
The Uber brand does not promote a social aspect, but they treat Uber Pool as a “Social experiment.” The brand originated as a premium service, and even in their cheaper UberX drivers often act like chauffeurs.
This dichotomy in brands will become apparent in pooled ridesharing. If riders engage socially, it seems that the Lyft brand would encourage drivers to participate and hence make the ride more social. It is unclear whether Uber encourages Pool drivers to engage with customers.
Method
To understand how pooled ridesharing differs from dedicated ridesharing as a system, we built a simulation in Python to analyze travel metrics between the two methodologies. The code is available on Github.
Model
The simulation has two similar models that represent the ridesharing methods being compared: pooled and dedicated ridesharing. We closely based our pooled ridesharing simulation on the Hitch model where drivers continuously pick up and drop off passengers. The fundamental difference in these models is how the vehicles report their available capacity. For dedicated ridesharing, a vehicle reports that it may pick up its full capacity if the car is empty, and it reports zero if it is non-empty. For pooled ridesharing, a vehicle reports that it is available to pick up as many passengers as there are empty seats available. All other aspects were the same between the models.
Travel Formulation
We modeled the simulation as an infinitely-long, straight road along which vehicles travel at a constant speed. By assuming that speed is constant, time becomes the primary unit for all variables. Every group has a "time" that they must travel rather than a distance.
In a dedicated environment, this means that an empty vehicle is assigned a group to pick up. Upon spawn, the simulation assigns a "time to pickup" - essentially how far down the road the group is from the vehicle. When the vehicle arrives, it waits a period of time for the group to get in the car. The vehicle drives as many seconds down the road as the group wishes to travel. After a period of time during which the group gets out of the car, the vehicle then idles until another group is assigned.
In a pooled environment, the same basic attributes apply, but group travel can be overlapped. First an empty vehicle is assigned a group with a "time to pick up." The vehicle travels that many seconds down the road to pick up the group. The vehicle waits while the group enters the car and then travels toward the group's destination.
At any time in the pooled environment, a vehicle with empty seats may be assigned a group to pick up, as long as the number of passengers in that group does not exceed the number of free seats. When a vehicle is assigned an additional group, that additional group also has a "time to pick up" representing how far the vehicle must travel to pick up that group.
This is where the "infinitely-long straight road" becomes relevant. We assume that, in a busy environment with sufficient drivers, vehicles can be intelligently routed between pickup and drop-off locations such that the driver must make negligible changes in the route to reach the destinations of other passengers. Thus, the act of picking up or dropping off extra passengers in a ride only extends the ride time of other passengers by the time it takes the vehicle to load and unload passengers. The route and speed of each vehicle are deterministic.
The model has two primary decision variables:
- Arrival Rate: The rate at which a new group enters the simulation. This is modeled as a binomial Poisson distribution and determined by a variable Lamda. Every second, a group has a given probability of being randomly generated.
- Vehicle Quantity: The number of vehicles that are available to drive passengers in a given model.
We aimed to only study the model at a steady state. Each simulation lasted for 7 hours, but the first hour of data was not logged so that new passengers entered a system already populated with running vehicles.
Groups
A group represents a set of people that are travelling together. They spawn randomly based on the arrival rate specifications. The group inputs, including behaviour attributes and spawn time, were the same between each model in a given simulation.
Groups had two attributes that were assigned at spawn: Size and travel time.
Size represents the number of passengers in the group, and it ranges from 1 to 3 people to replicate the allowed Hitch group sizes. In our model, we assumed that 70% of groups were of size 1, 29% of size 2, and 1% of size 3. The number of passengers of size 3 was limited because Hitch has a capacity limit of 3 passengers per vehicle, which essentially corresponds to a dedicated vehicle. Because it is still an option in the real world, we chose to include it but at a decreased frequency.
The travel time is a value representing how many seconds of driving it would take for the group to arrive at their destination. This value is randomly generated and normally distributed with a mean of 15 minutes.
Vehicles
A vehicle is the entity that services a group by picking it up and driving the group for its full travel time. The fundamental difference between a pooled and dedicated ridesharing vehicle is what determines how many passengers it may pick up. For vehicles in the dedicated model, a vehicle reports that it may pick up its full capacity if the car is empty, and it reports zero if it is non-empty. For pooled ridesharing, a vehicle always reports that it is available to pick up its capacity minus the current number of passengers. All other aspects were the same between the models.
Capacity is treated as a constant 3 based on the Hitch limit for number of passengers in a vehicle.
When picking up or dropping off groups, the time it takes to drive to the group and the time the vehicle must idle is randomly generated in a normal distribution. The average time that it takes to drive to pick up the group is 5 minutes. The average loading time, which represents the time it takes for passengers to enter or exit the vehicle and for a driver to change the destination in a GPS, is 3 minutes.
Limitations
- Constant Load: We sought only to quantify a set of approximately constant load. Thus, the number of vehicles or groups does not change over the course of a simulation.
- Turnaway: We did not build our system to model overloading - where more customers arrive than can be serviced. This could have been handled by building a "turnaway" that either quantifies how many passengers give up on searching for a car, for example with demand-based pricing. Instead, we queue all riders in an approximate first-in/first-out queue until a car is available to pick them up.
- Realistic Routes: Based on our assumption of an infinitely-long road of constant speed, we do not account for cases such as rush hour, wrong turns, or inefficient routing.
- Different Group Distributions - We compare the same distribution of group sizes between pooled and dedicated ridesharing, but this direct comparison may not reflect real-world usage.
- Assumed Variables - Many variables, such as distributions of pickup time, distributions of drop-off time, and group travel time are inferred based on our own experiences using ridesharing and realistic distributions for such values. The source code includes the full details of assumptions.
Procedure
Data was collected by independently varying the primary decision variables while holding all others constant.
Constant Vehicles, Increasing Arrival Rate
Constant Parameters:
- Simulation Time: 6 hours of collected data after 1 hour of warm-up
- Travel Time Average: 15 minutes
- Travel Time Standard Deviation: 3 minutes
- Vehicle Pickup Time Average: 5 minutes
- Vehicle Pickup Time Standard Deviation: 2 minutes
- Vehicle Loading Time Average: 3 minutes
- Vehicle Loading Time Standard Deviation: 30 seconds
- Number of Pooled Vehicles: 100
- Number of Dedicated Vehicles: 100
- Group Size Distribution: 1 Passenger - 70%, 2 Passengers - 29%, 3 Passengers - 1%
Variable Parameters:
- Arrival Rate: Increasing from 0.01 to 0.19 by increments of 0.01
Constant Arrival Rate, Variable Number of Vehicles
Fixed Parameters:
- Simulation Time: 6 hours of collected data after 1 hour of warm-up
- Travel Time Average: 15 minutes
- Travel Time Standard Deviation: 3 minutes
- Vehicle Pickup Time Average: 5 minutes
- Vehicle Pickup Time Standard Deviation: 2 minutes
- Vehicle Loading Time Average: 3 minutes
- Vehicle Loading Time Standard Deviation: 30 seconds
- Number of Dedicated Vehicles: 100
- Arrival Rate: 0.06
- Group Size Distribution: 1 Passenger: 70%, 2 Passengers: 29%, 3 Passengers: 1%
Variable Parameters:
- Number of Pooled Vehicles: Decreasing from 100 to 49 by increments of 3
Analysis
"Fewer drivers are able to service the same number of riders."
We hypothesized that fewer vehicles are able to service the same number of riders. The main cost to ridesharing companies is driver time, so being able to transport more passengers with the same number of drivers means that cost per passenger decreases.
To substantiate this hypothesis, we held the number of vehicles in the simulation constant at 100. The arrival rate was then varied in order to determine the point at which the system became overloaded.
To determine the point at which the system exceeds its equilibrium and becomes overloaded, we looked for the arrival rate where passengers had to wait at least 5 minutes for a vehicle to be assigned to them - thus indicating that new passengers were arriving more quickly than they were being dropped off. In a real-world scenario, this is the point when dynamic pricing models ("Surge" or "PrimeTime") would increase cost in order to decrease the number of passengers calling a ride.
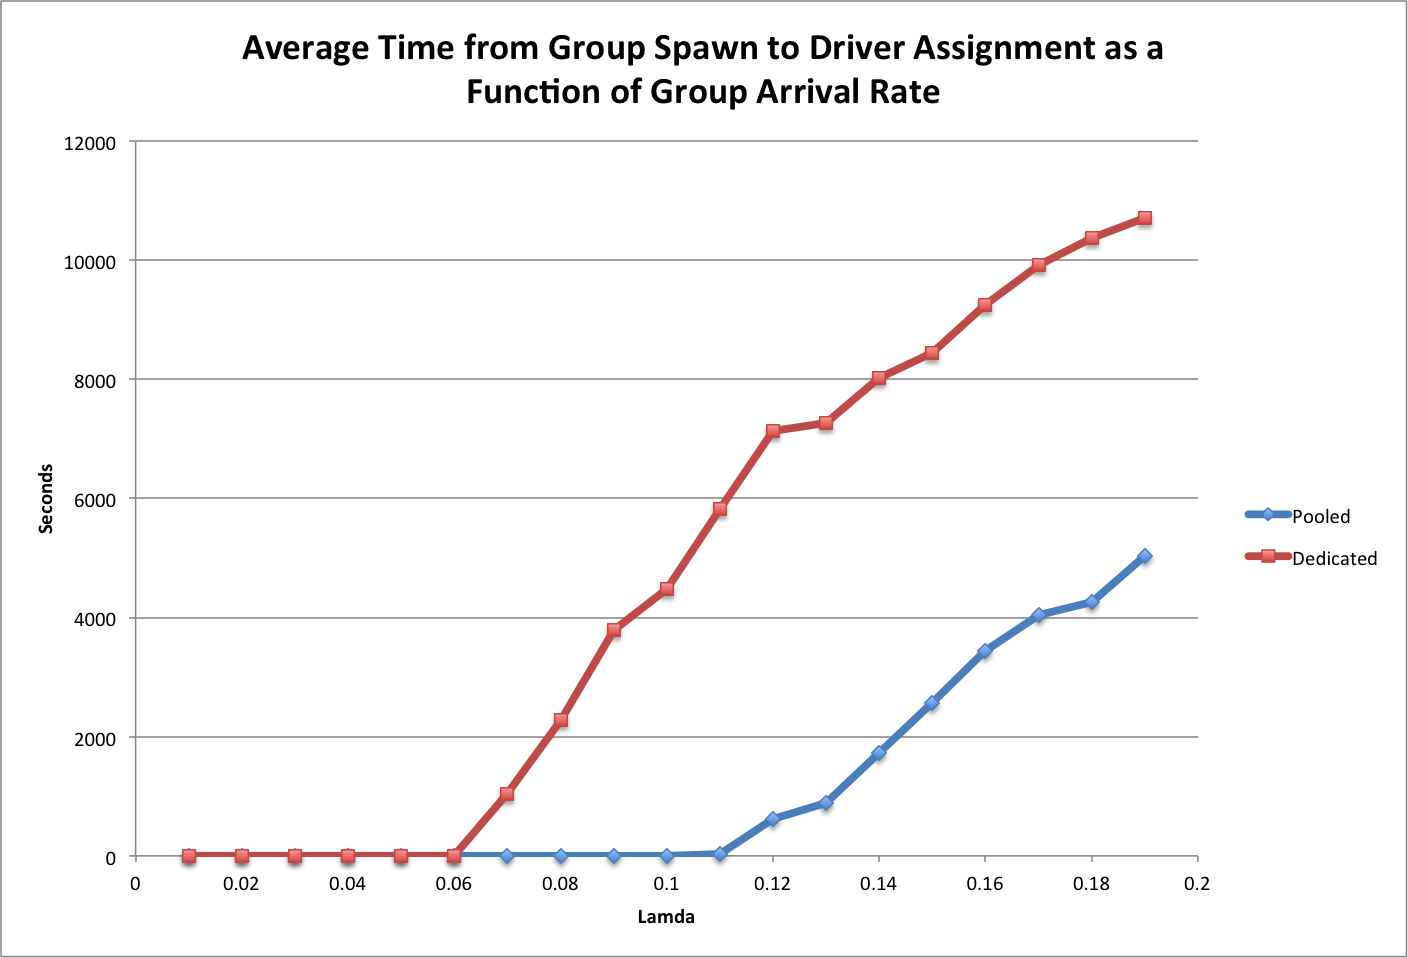
The arrival rate was measured as arrival rate, lambda, which represents the probability in a given second that a new group of passengers would spawn. The average hourly arrival rate is lambda times the seconds in an hour.
This model showed that dedicated ridesharing became overloaded between a lambda of .06 and .07. Pooled ridesharing became overloaded between .11 and .12. Thus, the same number of drivers was able to service between 216 and 252 groups of passengers in a dedicated environment, and between 396 and 432 groups of passengers in a pooled environment. Because distribution of group sizes was the same between environments, we conclude that a pooled environment may service the same number of riders with fewer drivers. Furthermore, we conclude that, within our simulation parameters, about half as many drivers may service the same arrival rate of passenger groups in a pooled environment versus a dedicated environment.
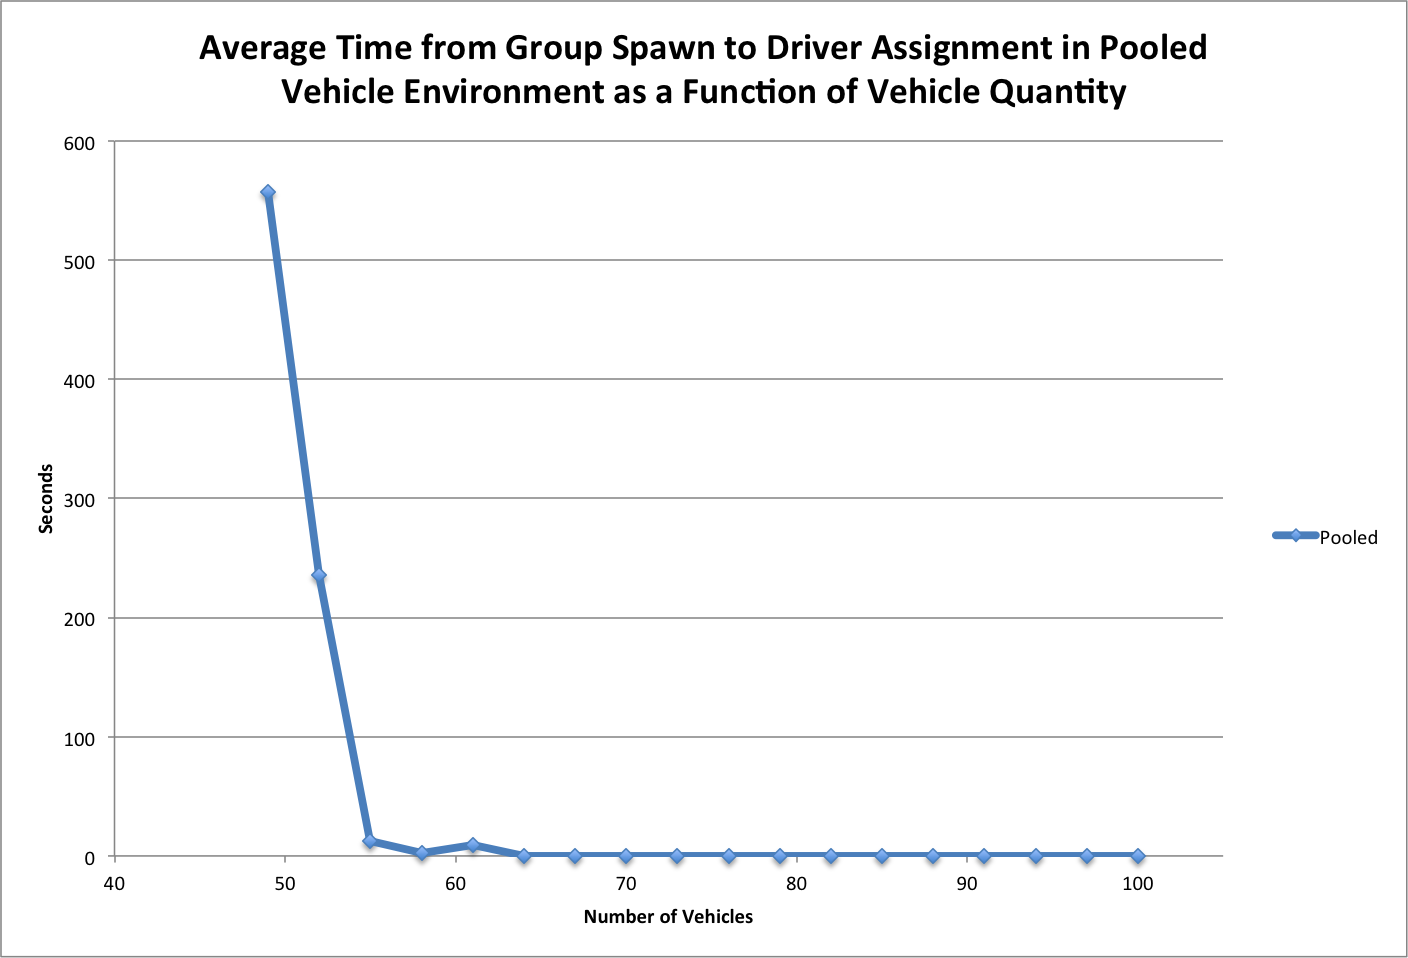
To quantify how many fewer vehicles were necessary, we ran an experiment with a decreasing amount of vehicles and a lamda fixed at the equilibrium arrival rate for dedicated ridesharing; the highest lamda before a system becomes overloaded. With lambda set to .06, the dedicated ridesharing equilibrium for 100 vehicles, we found that 52 pooled drivers could service the same arrival of groups with less than 5 minutes of wait time from spawn to driver assignment - 48% fewer drivers.
If drivers' pay is considered constant per hour, independent of distance driven, then being able to service the same number of customers with half as many drivers cuts costs by about half. Thus, Uber's assertion that their pooled rides cost 40% less than dedicated rides substantiates our conclusion.
"Pooled ridesharing has significantly higher driver utilization"
We hypothesized that pooled drivers, relative to dedicated drivers, would not have to wait between calls to pick somebody up. Instead, by constantly picking up and dropping off groups of passengers, they would rarely have an empty car.
To determine the average driver utilization in a system, we calculated the percentage of time that vehicles were in a "billable" state - either driving with passengers in the car, or idling to drop off or pickup passengers while others remained in the vehicle. An empty vehicle en route to pick up a passenger was considered unutilized even though it was not idle.
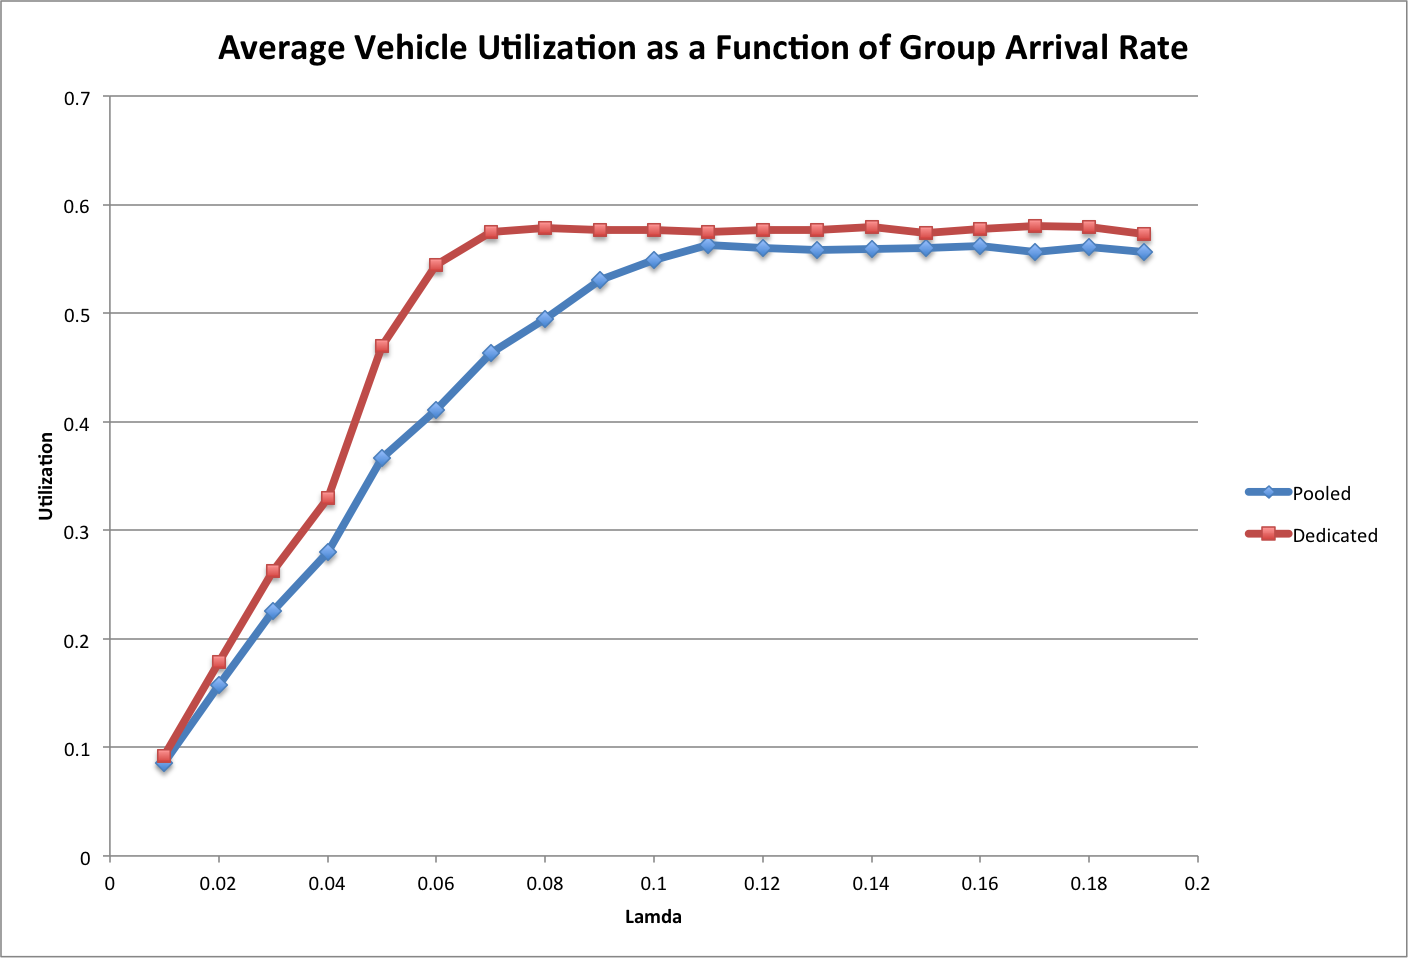
Our model showed that, at the equilibrium points for each model, driver utilization was approximately equal. This refuted our hypothesis by showing that pooled ridesharing does not increase the number of billable hours for a driver when the system has a high arrival rate.
"Pooled ridesharing takes longer for riders to arrive at the destination"
If the vehicle has to pause to pick up and drop off other passengers, then the travel time increases. To determine how much longer a pooled ride would take relative to a dedicated ride, we analyzed the travel time of groups in the models.
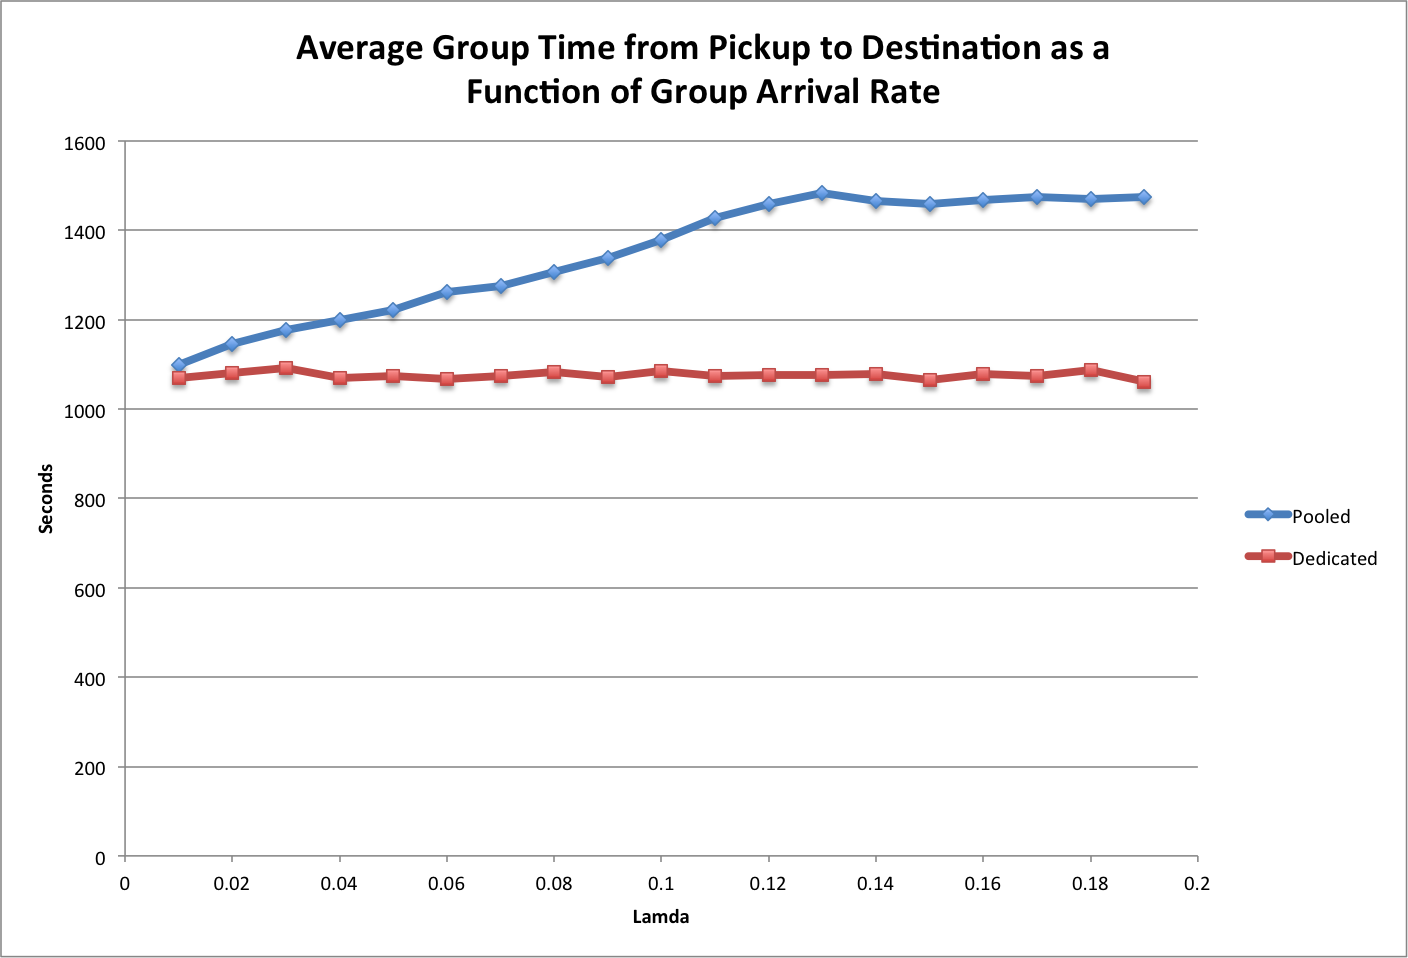
This graph shows that, in general, pooled rides take longer than dedicated rides. The points of best comparison are the equilibrium arrival rates of .06 and .11 for dedicated and pooled, respectively. Thus, at the equilibrium point the travel times vary by about 27% - or 7 minutes longer than the average travel time of 18 minutes in our model.
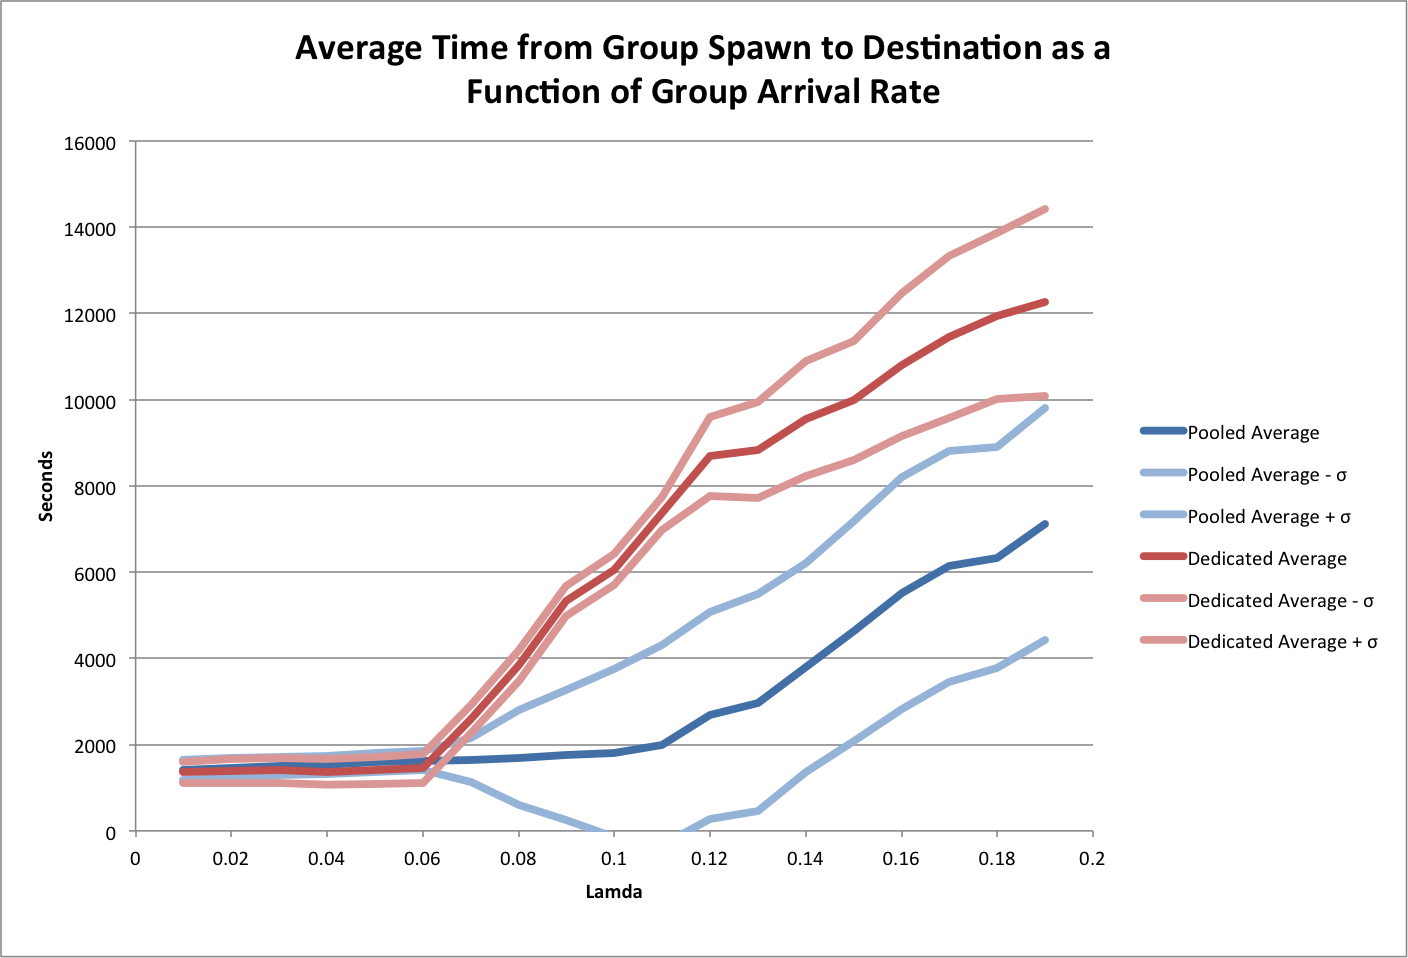
When comparing the range of total travel times for both models, pooled vehicle travel times are highly inconsistent, and thus could take considerably longer than a dedicated ride in some cases.
"Pooled ridesharing is only efficient for one rider"
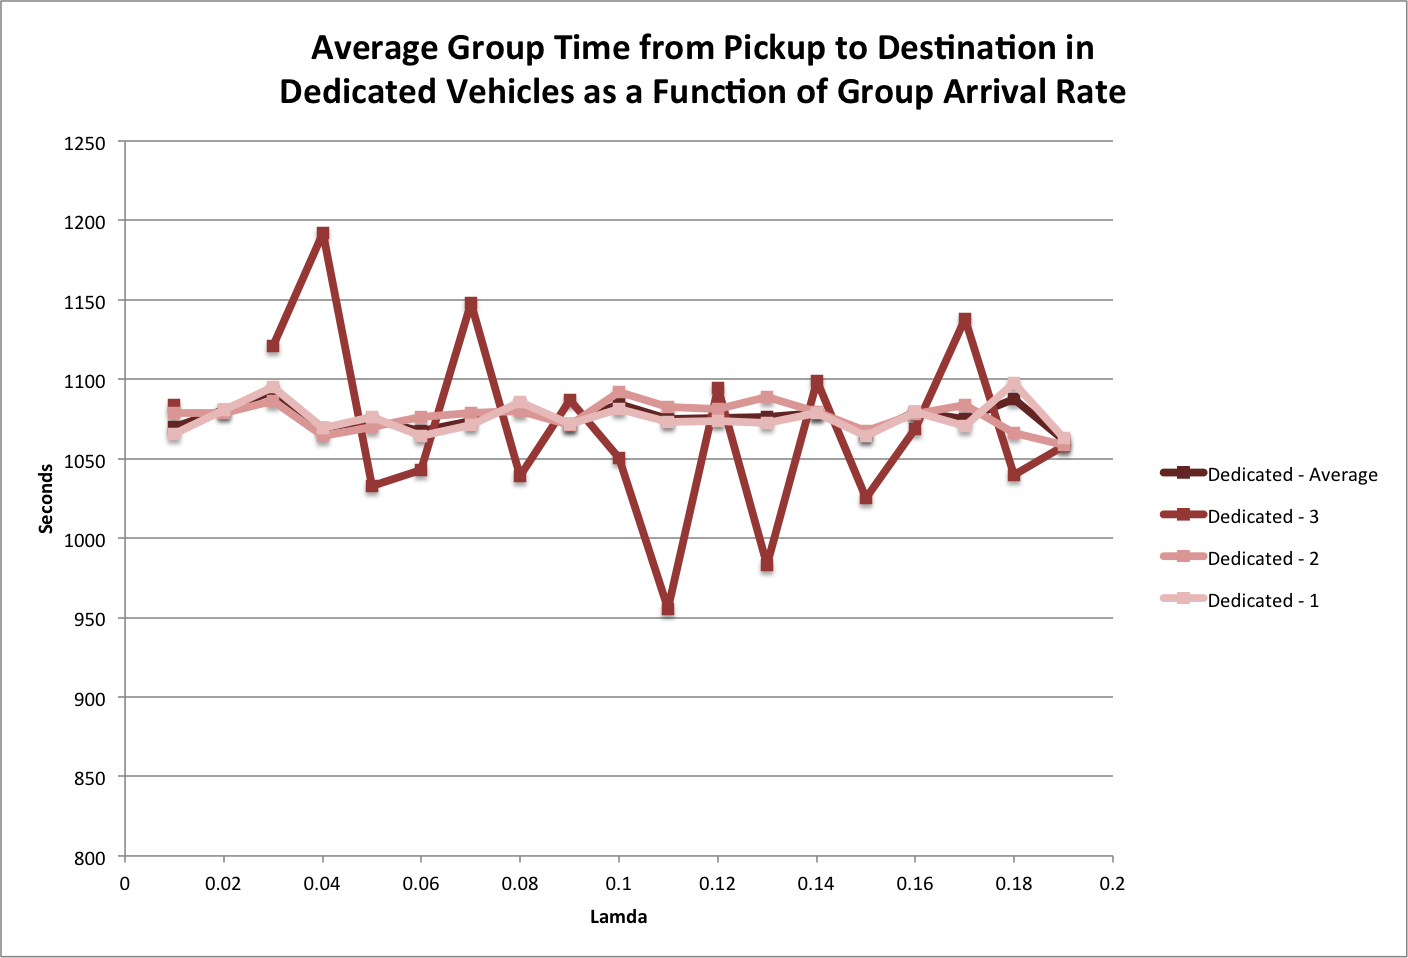
Hitch allowed groups of up to 3 people to be transported. Because a group of 3 in a pooled ride environment functionally becomes a dedicated car, we did not expect a different travel time for this group size in dedicated vehicles. We sought to determine how groups of two passengers compared in travel time to groups of one passenger.
First, it is important to establish that dedicated rideshare travel time is essentially invariable with regard to group size. Fewer data points were available for groups of 3 passengers, resulting in more variance.
When comparing the travel times of pooled versus dedicated vehicles at an arrival rate equal to the equilibrium point for the model, we sought to segment the average travel increase time of 27% between groups of one and two riders.
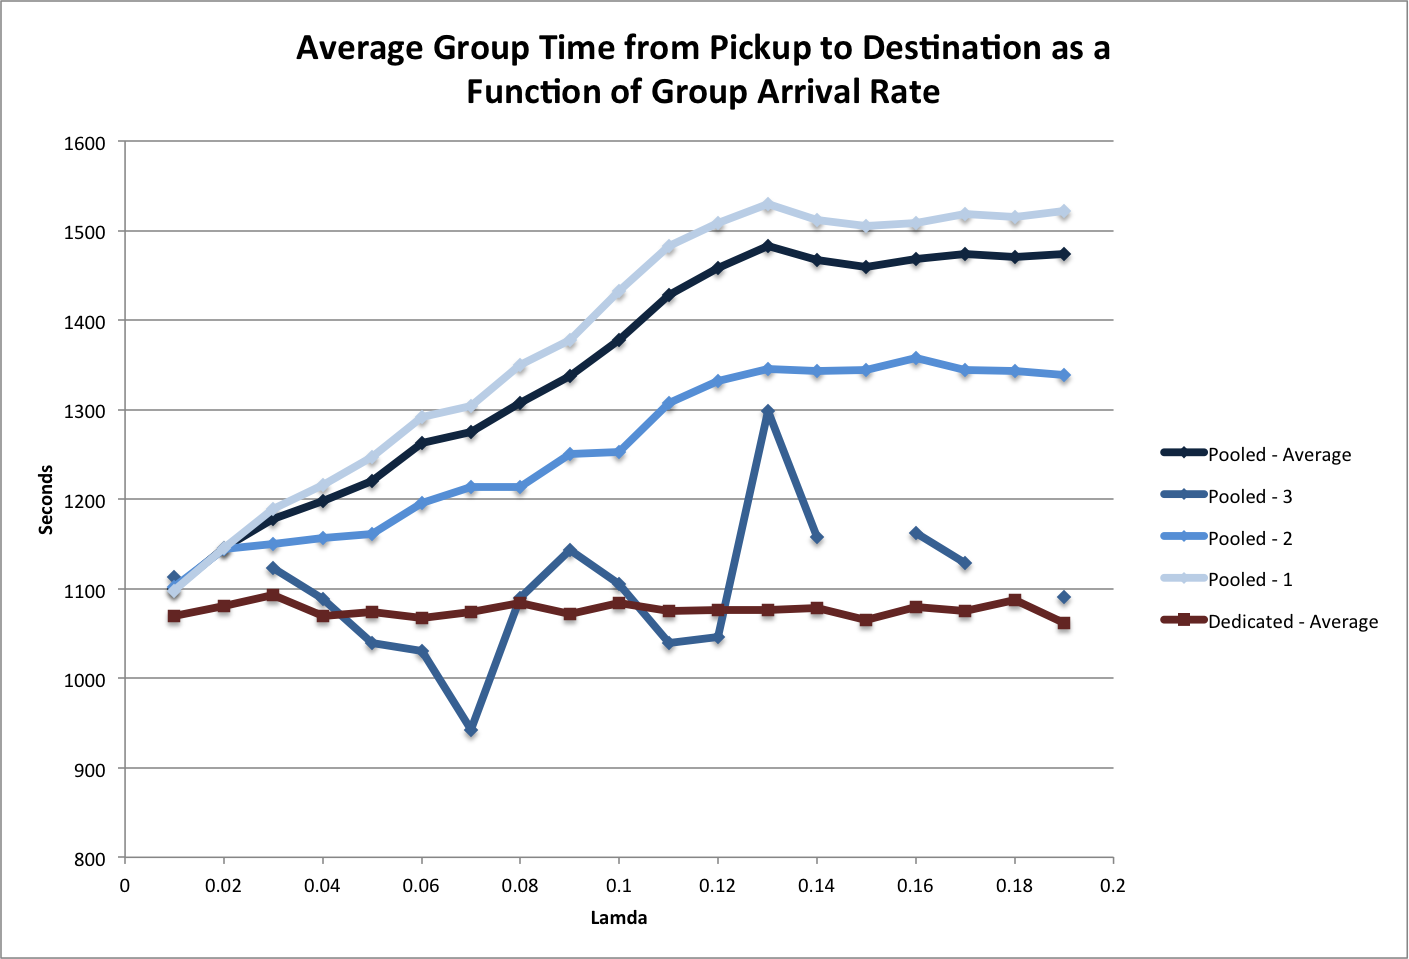
The model shows that the travel time for a single passenger in a pooled rideshare is 35% longer than a dedicated rideshare, and 18% longer for a group of two passengers. This drastic difference means that groups of more than one passenger essentially get priority in our formulation of the Hitch model because the vehicle lacks the available space to pick up as many accompanying passengers.
The conclusion from this data is that our interpretation of the Hitch model of ridesharing can take significantly longer for single riders. This lends credence to the formulations by Uber and Lyft where the number of other groups that may share a ride is limited, resulting in a fairer experience for single riders.
Conclusions
- The Hitch model of ridesharing adds about a third more time for a single rider to reach their destination. If the target audience is single riders, then reformulating the pickup model to limit the number of co-riders may be beneficial.
- Pooled ridesharing is a cheaper option due to higher throughput, not due to higher driver utilization.